Introducing Atomic Force Microscopy
This post has been a long time in the making - I originally learned to use an atomic force microscope in January (I began on Inauguration Day, actually) and have done a lot of reading since then, but I have not paid my technical debt on my newfound knowledge. This post (and likely a follow-up as well) will outline how atomic force microscopy works, what some of the common variations of the technique are, and how to collect good data using AFM. I think I will save discussing probe selection for a separate post, though, because it can get a little complicated. So without further ado, let’s get started!
The Basic Principle of Atomic Force Microscopy
The original idea that eventually became atomic force microscopy (AFM) was introduced by Binnig, Quate and Gerber in 1986 [1]. The technique is a high-resolution, non-optical imaging technique that is capable of accurately, non-destructively imaging samples down to the nanometer scale [2]. We can image samples in air, in liquid or in a vacuum, using a probe whose motion we track using a laser [2]. We say that the technique is non-optical because we do not use light as the medium by which we gather information about the sample*1, we are instead physically dragging a very sharp probe over the surface of our sample. Optical microscopy has a diffraction limit that prevents it from resolving features smaller than several hundreds of nanometers in size, and AFM allows us to probe down to scales smaller than that.

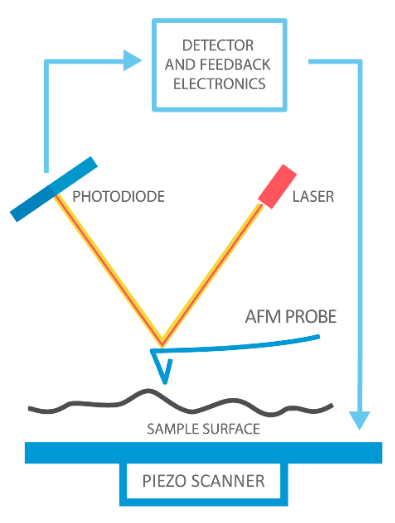
Figure 1 - Source: [2]
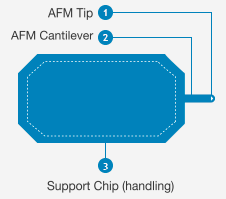
The basic principle of AFM is shown in Figure 1. We have a very sharp (<10nm radius) tip on the end of a cantilevered beam. The tip is interacting with the surface of the sample, which is mounted on a piezoelectric ceramic stage. The stage moves the sample in x, y and z directions. The stage is trying to maintain a constant level of interaction between the tip and the sample surface. We have focused a laser light on the cantilevered beam and we are reading how that laser is reflected using a photodiode. The tip travels relative to the sample surface in a raster pattern to measure the sample in 3 dimensions. The AFM system has software that is maintaining a feedback loop - it reads in the deflection of the laser light (i.e. the position of the probe tip) and sends commands to the piezo stage to maintain a constant amount of interaction between the sample surface and the tip [2].

Figure 2 - Source: [2]
What kinds of interactions are happening between the probe tip and the sample surface? It will depend somewhat on the type of AFM technique used (because this affects how close the tip is to the sample surface) but in general, there are interaction forces occurring such as electrostatic interactions, van der Waals forces and the probe may actually be physically in contact with the sample surface at times. All of these interactions cause the probe to deflect, which is measured by the laser and the photodiode. This information is used by the control loop to move the piezo stage so that the interaction forces are maintained at some constant setpoint established by the user [2].
Ultimately, the data that we are collecting with the AFM system is the position data of the tip in 3 dimensions, which we can use to reconstruct 2D and 3D images of the sample surface [2].
AFM Modes
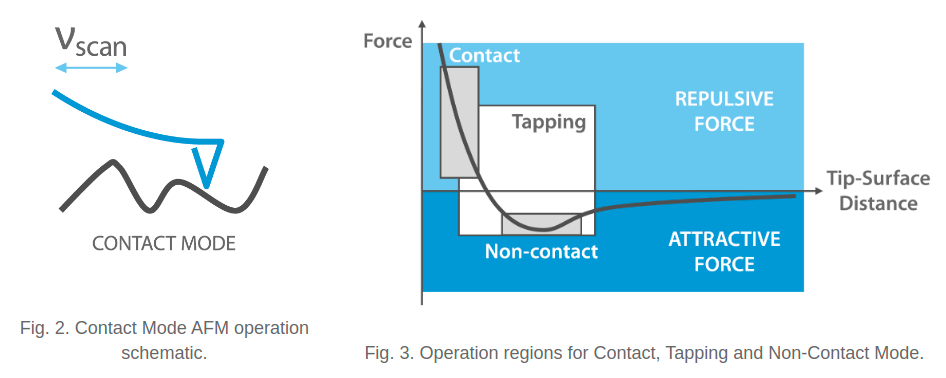
There are two primary modes of AFM imaging that are commonly in use today. The first is static (or contact) mode, and the second is dynamic mode [2]. Static mode scans the probe across the sample surface while maintaining a constant setpoint of interaction - that is, the probe is kept at some constant deflection, which is equivalent to some constant interaction force [2]. The forces between the probe tip and the sample are repulsive, as shown in Figure 3. In static mode, we typically use soft cantilevers (with force constants less than 1 N/m) in order to minimize wear and tear on the tip, and to increase sensitivity of the probe. There are some downsides to static mode, including the fact that the tip is susceptible to lateral forces during scanning, and the tip often sticks to the surface contamination layer that appears on many samples. Both of these phenomena cause image distortions, and can damage the tip and the sample [2].

Figure 3 - Source: [2]
An alternative to static mode is dynamic mode, which is characterized by using a probe that is constantly oscillated by a piezoelectric actuator at approximately the probe’s resonant frequency, in the tens to hundreds of kHz. There are actually two sub-categories of dynamic mode: tapping mode and non-contact mode [2]. We discuss tapping mode first.
In tapping mode, we are monitoring changes to the oscillations of the tip as it scans over the surface. Specifically, as the probe is brought close to the sample surface, the tip will touch the surface while at the trough of its oscillation. This contact will dampen the amplitude of the oscillation, which we can measure in our feedback loop. The control system for the AFM machine will try to maintain a constant cantilever oscillation amplitude and, by extension, a constant interaction force between the probe and the sample [2].
In dynamic mode, the forces that dominate the probe’s interaction with the sample are also repulsive in nature. We tend to use stiffer cantilevers (10 - 100 N/m) with higher resonant frequencies (>190 kHz) for this type of scanning. We want stiffer cantilevers because they are not as likely to stick to the sample surface when measuring in air, although we may choose to use more flexible cantilevers (<10 N/m) if we are studying soft samples (like DNA).
Non-contact mode is very similar to tapping mode, except that we oscillate the cantilever with a smaller amplitude than in tapping mode (typically less than or equal to 1nm). The probe is kept close enough to the surface that it experiences attractive, instead of repulsive, interaction forces. Often the feedback loop is also used to maintain a constant oscillation frequency. This mode is particularly useful for precise force control, and collecting high-resolution images in liquid-phase imaging [2].
The low interaction forces in non-contact mode help to preserve tip sharpness and thereby achieve high resolution images. However, it is difficult to keep the tip in this regime of attractive forces, and requires robust feedback control. Cantilevers with high force constants and high resonant frequencies are typically used for non-contact mode [2].
It is worth noting that in general, the vertical resolution of the data collected via AFM is dependent on the piezoelectric scanner, not on the probe geometry. The probe geometry, however, does impact the lateral resolution of the scan. This is because the lateral dimensions of features measured by the probe includes the diameter of the probe in the measurement (because the probe first encounters the feature on one side of its diameter, and it does not stop interacting with a feature until the other side of the probe has cleared that feature). This is shown in Figure 4. I will go into detail on the process of probe selection in another post, but the point here is that probe selection determines lateral, but not vertical, resolution of the scan.

Figure 4 - Source: [3]
Data Collection Process with AFM
Now that we have an understanding of how AFM works, let’s talk about some best practices for preparing samples and collecting data with an AFM machine.
Sample Preparation
In general, we always want very clean samples for imaging with AFM, since at nanometer-scale resolution we will definitely see any dust or other particulates on the sample surface. The samples are usually deposited on mica because it can be cleaved to atomic-level flatness, and is relatively cheap. Mica is typically negatively charged. When you are depositing your sample on the mica, you want good adhesion so that the sample sticks to the mica substrate, and not to your probe tip. The droplet of sample you deposit should also be very clean, and you should keep in mind that once the solvent dries, the particle concentration increases and the salt concentration increases, which may affect your sample. You also want to be sure that your sample is grounded once it is placed on the piezoelectric stage - otherwise its electrostatic charge will bend the probe towards the sample surface [4].
Experimental Set Up and Data Collection
Once you have your samples ready, you need to place your sample on the stage and prepare your probe. It is recommended that you use a grounding wristband and/or electrostatic discharge (ESD) mat while you are manipulating your probe, because any electrical discharge could destroy the probe tip [2]. Once the probe is inserted and calibrated, you should carefully approach the sample with the probe. You may need to optimize your feedback parameters during scanning (unless you are using a system that does this automatically) - I will discuss this process in a separate post [4].
Data Analysis
After you have collected your data, you will need to post-process it. Many AFM systems will have proprietary software for this, but you can also use Gwyddion, which is an open-source tool that is a standard in academia. Generally, post-processing involves removing the background, displaying the image and extracting data as required [4]. There are some excellent webinars available at the AFM Workshop website, as well as tutorials for using Gwyddion as linked above. They describe the typical post-processing workflow, as well as some of the common causes of image artifacts.
Thank you for reading this introductory post on AFM technology. I plan to follow up with a post on probe selection, and possibly another on optimizing scanning conditions.
Footnotes:
*1 A friend of mine stumped me once by pointing out that AFM still uses a laser, and so shouldn’t this process still be limited by the diffraction limit? After talking to the experts at the university about it, I have concluded that the diffraction limit still is not a problem here because the laser is measuring the deflection of the cantilever attached to the probe. The cantilever is a lever that amplifies the small motions of the probe into larger motions that can be measured by the photodiode reading the laser signal. So we have cleverly used mechanics to amplify our light signal and overcome the diffraction limit in this case.
References:
[1] Binnig, G., Quate, C. F., & Gerber, C. (1986). Atomic force microscope. Physical Review Letters, 56(9), 930–933. https://doi.org/10.1103/PhysRevLett.56.930
[2] “What is Atomic Force Microscopy (AFM).” NanoAndMore USA. https://www.nanoandmore.com/what-is-atomic-force-microscopy Visited 05 Apr 2021.
[3] Atomic Force Microscopy (AFM). (2020, September 11). Retrieved April 5, 2021, from https://chem.libretexts.org/@go/page/278511.
[4] “Measuring Great AFM Images: 4 Criteria.” AFM Workshop. https://www.afmworkshop.com/newsletter/275-measuring-great-afm-images Visited 05 April 2021.
