Compensator Design with Bode Plots
I am one week away from my qualifying exam and I am hustling to cover a couple more topics before the exam. Today I am going to do a couple posts on designing lag compensators with Bode plots as my design tool. (Hopefully I will cover lead compensators tomorrow.) I have several earlier posts on lead and lag compensators if you need a basic review.
Before I started reading Nise today, I thought that Bode plots were useful for designing controllers to meet steady state requirements but that they had no utility in designing for transient response. My intuition told me that the magnitude and phase plots show how the system responds at steady state. In fact, when we solve for points on the Bode plot, we only substitute in the steady state term (omega), and we ignore sigma (which determines the decay of the transient response). But I was wrong!
The Bode plot is actually related to the system’s transient response via the damping coefficient (and therefore its percent overshoot, and other transient characteristics) in both the magnitude and phase plots [1]. The magnitude plot shows the system’s bandwidth, which is related to the damping coefficient via the equation below [1]. Note that the natural frequency term in the expression can be expressed both in terms of the settling time and the peak time as desired [1]. Nise states that the larger a system’s bandwidth, the faster it responds to an input [1]. I do not have a good intuitive explanation for why that is (bandwidth itself is actually a little difficult for me to understand) but the equation below does show that relationship mathematically [1].

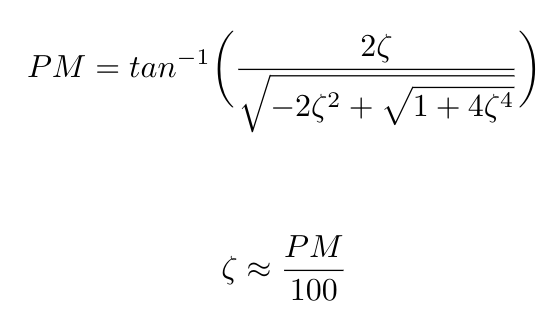
As for the phase plot, the phase margin of the system is also related to the damping coefficient (and therefore it is also related to other transient response characteristics) [1]. We can see the relationship in the equation below [1]. Nise also states that as the phase margin increases, the percent overshoot decreases [1]. I think this makes a little more intuitive sense to me: the phase margin is a measure of stability, so the more stable your system is, the less overshoot you should see when it responds to an input.
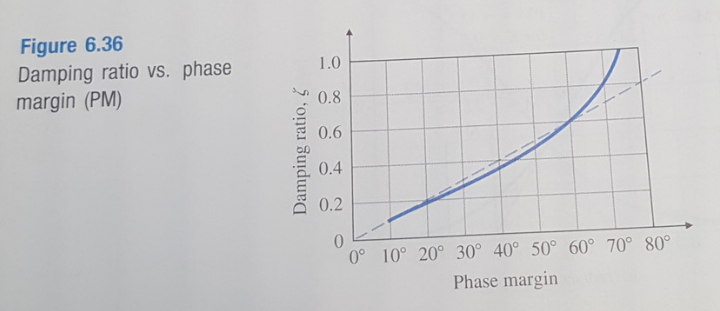
You may notice that the equation I gave above is complicated, and difficult to remember. Franklin et al tell us that it is also possible to represent this function with a linear approximation, for phase margins up to about 60 degrees [2]. The equation and the plot that illustrates it are shown below [2].

 Figure 1
There are a couple more random points that I would like to make about using Bode plots to design controllers. I may have said this incorrectly in an earlier post, but Bode plots do indeed contain stability information, encoded as the gain and phase margins of the system. This information can be useful in evaluating the closed loop stability of the system. Nise suggests that we use the Nyquist stability criterion to complement our understanding obtained via the Bode plot [1]. He suggests that we use the Nyquist criterion to evaluate the open loop stability of a system, and we can predict that an open loop stable system will also be closed loop stable if we have some gain margin on the open loop Bode plot [1]. But he also suggests elsewhere in the text that “the Nyquist criterion relates the stability of a closed-loop system to the open-loop frequency response and open-loop pole location” (page 619) [1]. So I think it is better to say that the Bode plot tells us about open loop stability; the Nyquist plot tells us about closed loop stability.
One more random point - the higher the DC gain (or low frequency magnitude) of the system as shown on the Bode plot, the lower our steady state error will be [1]. I think this makes sense to me because we measure the steady state error at the limit where s goes to 0 (i.e. where the frequency goes to 0, at the DC gain point). The steady state error is inversely related to the magnitude of the system’s response at this limit, so the larger the magnitude of the system’s response, the smaller the steady state error will be.
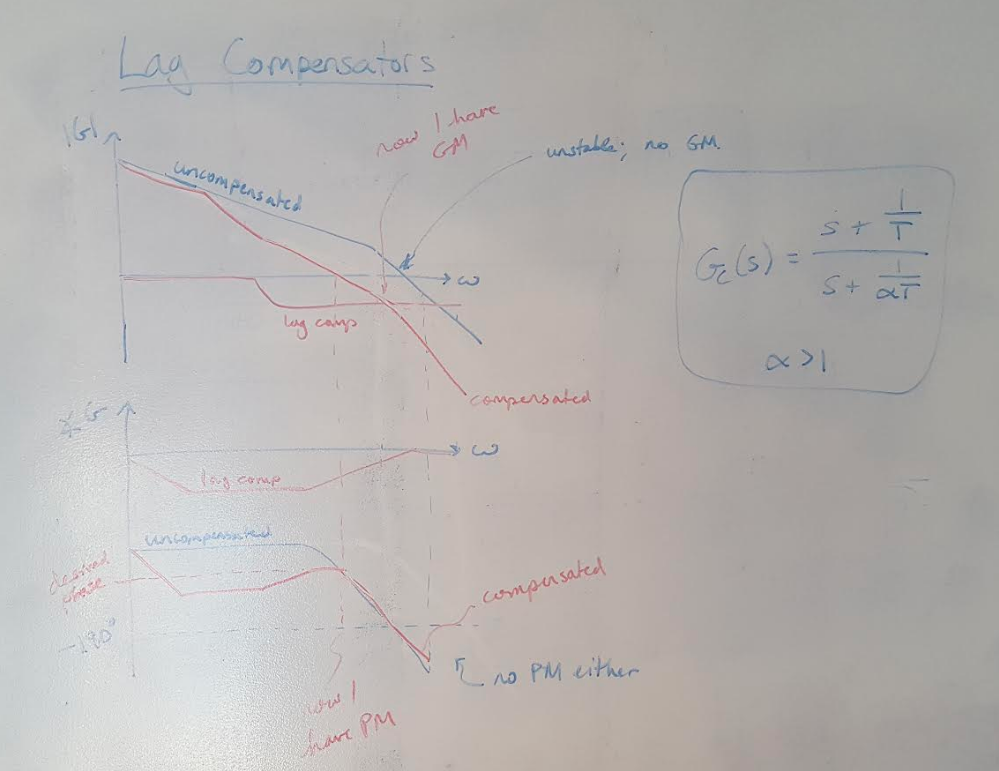
Now let’s turn to the Bode plot of a lag compensator. I drew the uncompensated system in blue, and then drew both the pure lag compensator and the compensated system in red (I’m short on marker colors) [1]. We can see that while the uncompensated system does not have any gain margin or phase margin, we can use the lag compensator to shift the magnitude plot down and to move the phase to the desired value so that we can obtain both gain and phase margin, which increases our system’s stability [1]. In my next post, I will go through a specific example of designing a lag controller.
 Figure 2
References:
[1] Nise, Norman S. Control Systems Engineering, 4th Ed. John Wiley & Sons, Inc. 2004.
[2] Franklin, G., Powell, J.D., Emami-Naeini, A. Feedback Control of Dynamic Systems, 6th ed. Pearson. 2009.
