Remembering Dynamic Light Scattering from 2 Years Ago
There are many ways to characterize and measure DNA nanostructures, and today I wanted to write about one tool in particular, dynamic light scattering (or photon correlation spectroscopy). Dynamic light scattering (DLS) is used to measure very small particles, typically on the order of 0.6nm - 6um, by studying how they move in solution [1]. I actually first learned to use DLS two years ago, but I didn’t write down a good summary of what I had learned so I am making sure that I write down the basic operating principle this time! In this post, I’m going to give an outline of how the method works, then go into some of the mathematics used in the analysis. Let’s get started!
The Basic Principles
Dynamic light scattering measures the Brownian motion of particles in solution, and relates that motion to a specific particle size. Brownian motion simply refers to the random motion of particles suspended in a fluid - the suspended particles are constantly moving (or diffusing) as they collide with molecules of the fluid. At its core, DLS relies on the fact that big particles move more slowly than small particles. DLS shines a light on the particles (both metaphorically and literally!) and measures how that light is scattered over time. By studying how the light is scattered, we can draw conclusions about the size of the particles in the fluid [1].
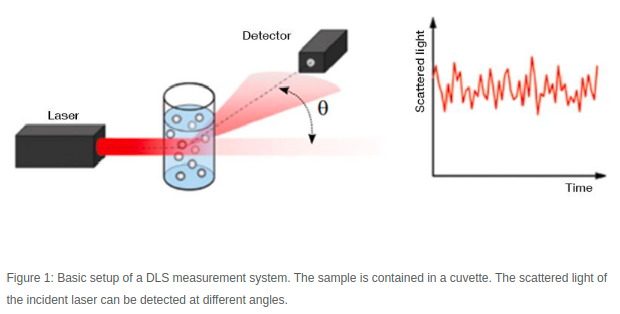
Figure 1 - Source [2]
A DLS machine collects data by shining a laser through a sample, and then recording the scattered light intensity many times over a very short time interval. Figure 1 shows a schematic of the setup commonly found in DLS machines. The particles in the fluid are scattering the light, generating a signal that varies over time. We compare each snapshot of the light intensity to the first measurement we took, and we compare how similar they are. Let’s imagine we are looking at the first snapshot, and the second one, taken after some very small time interval (let’s say 10 nanoseconds). The particles have not moved very much in 10 nanoseconds, so the light intensity signals at these two points in time are very similar to each other. But after 50 nanoseconds (5 time steps later) the particles will have moved enough that the new measurement of the light intensity signal does not match the first measurement very much at all [1-3]. This idea is shown in Figure 2.
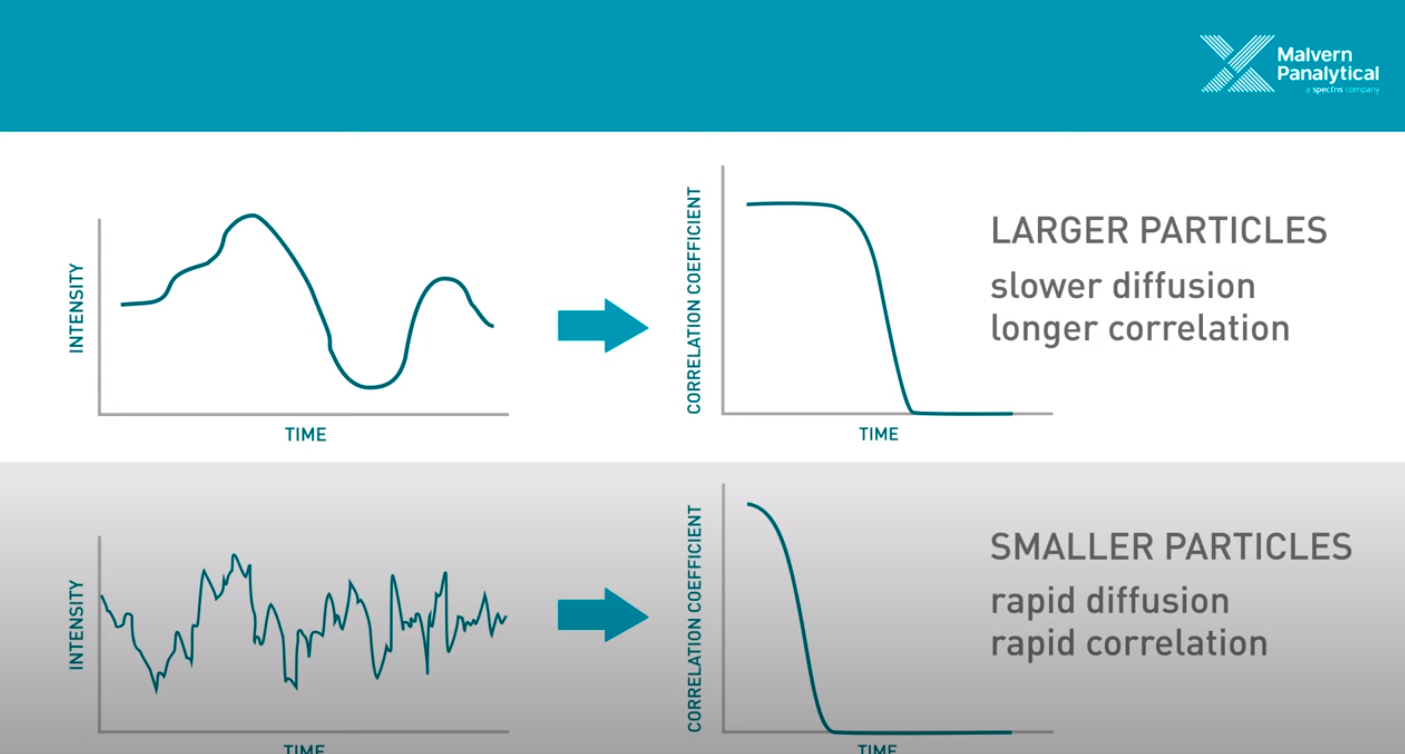
Figure 2 - Source [3] (The video on [3]’s website is an excellent 5 minute overview of DLS.)
Okay, so we know that we are taking measurements in quick succession of the light that is scattered by the particles in solution. We can compare subsequent measurements to the first measurement taken, and measure how similar they are using a correlation function. This correlation function returns a value of 1 if the two signals are identical, and a value of 0 if they are completely different [1]. We use this correlation function to draw a curve depicting the correlation over time (also called a correllelogram), as demonstrated on the right hand side of Figure 2 [1]. Now, remember that we said that DLS relies on the principle that larger particles move (or diffuse) more slowly than small particles? This comes into play in the analysis, because we can look at how quickly the correlation curve drops from 1 to 0. If the particles are moving faster, then it makes sense that the correlation curve should drop more quickly, because the light scattering signal is going to change more quickly as the particles diffuse at high speed. In contrast, if the particles are moving slower, the correlation curve will decrease more slowly, because the particles are not changing their configuration (and hence the scattered light pattern) as quickly. And we know that the particle speed is directly related to their size, so now we can draw a conclusion from the correlation curve about the size of the particles that we are observing [1].
So ultimately, we are looking at how quickly the intensity of scattered light changes to derive the size of the particles that are scattering the light in solution. There are a couple things I want to point out before we dive into the analysis that supports this idea. First, this approach relies on the assumption that the only type of motion we are observing is Brownian (i.e. random) motion. If the particles are very large, however, they will also be heavy enough that they will tend to fall to the bottom of the sample container (the “cuvette”) over time [2]. If this “sedimentation” happens, then that negates our assumption of Brownian motion, and we cannot use this analytical method. This is why there is an upper bound to how large of a particle we can study [2]. By contrast, the lower bound is enforced by the fact that if the particles are too small, then they will not scatter very much light and it will be difficult to differentiate them from the noise in the signal [2].
Secondly, the analytical process used here is assuming that the particles are spherical and we are trying to find a hydrodynamic radius for a spherical particle that best fits the dataset. However, we might not actually be measuring spheres in reality! So we just need to keep in mind that this disconnect exists between the model we are fitting to the data, and what is actually happening experimentally [1].
Mathematical Models and Analysis
The DLS method relies on the Stokes-Einstein equation that relates the particle size to the particle diameter as follows [1,2]:
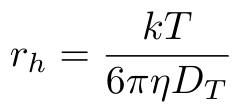
Equation 1
Where k is the Boltzmann constant, T is the absolute temperature, eta is the solvent viscosity and Dt is the diffusion coefficient of the particles [1]. The value rh is the hydrodynamic radius of a hypothetical spherical particle that would generate the measured data [1]. This is where our assumptions of purely Brownian motion and spherical particles come from.
In order to find the hydrodynamic radius, we need to compute Dt, the diffusion coefficient. We can do this by leveraging our correlation data that we discussed in the previous section. If we fit the following model to the data, then we can find the decay rate of the correlation function [1]:

Equation 2
The parameter A describes the baseline correlation value at time = infinity, while the parameter B describes the initial correlation value [1]. The parameter tau is the time, and gamma is the decay rate of the fitted correlation curve. We use gamma to compute the diffusion coefficient as follows [1]:
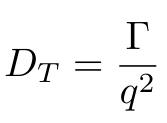
Equation 3
Okay, we’re almost there, I promise. But as you can see in Equation 3, we have one more parameter that we need to calculate, which is q, the magnitude of the scattering vector [1]. We can calculate q using Equation 4 [1]:
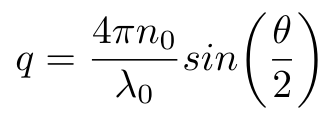
Equation 4
Where n0 is the refractive index of the liquid, lambda is the wavelength of the incident light in vacuum and theta is the scattering angle used in the DLS machine [1]. Now that we have this last piece of the puzzle, we can compute the diffusion coefficient of the particles in the fluid and, by extension, their hydrodynamic radius, using Equation 1.
But there is a disadvantage to this approach: it assumes that the particles are monodisperse, i.e. that they all have the same diameter, and this might not actually be true in practice. In this case, it helps to look at some other data that is commonly provided by DLS machines. Specifically, we can look at the intensity distribution, which shows the relative intensity of the signal with respect to the size of the measured particles. We can also look at the volume distribution, which shows the distribution of volumes among the population of particles of different diameters [1]. Some example plots are shown in Figure 3. These distributions will illustrate if you have a polydisperse population of particles, and may disagree with the single hydrodynamic radius value that you calculate using Equation 1.

Figure 3 - Left: Fitting a curve to the correlation data provided by a DLS machine. Middle: The intensity distribution for a given set of 10 samples. Right: The volume distribution for a given set of 10 samples.
Conclusions
So we have learned the basics of how DLS works and how to analyze the intensity signals that we collect with a DLS machine. There is more complexity to the process, of course, than I have described here, and I may write a follow-on post if I dig into this in more detail. Stay tuned!
Resources:
[1] “Particle Sizing using Dynamic Light Scattering Theory and Measurement Principle.” Chemical Engineering 39-801. Carnegie Mellon University.
[2] “The principles of dynamic light scattering.” Anton Paar. https://wiki.anton-paar.com/us-en/the-principles-of-dynamic-light-scattering/ Visited 23 Feb 2021.
[3] “Dynamic Light Scattering (DLS).” Malvern Panalytical. https://www.malvernpanalytical.com/en/products/technology/light-scattering/dynamic-light-scattering Visited 23 Feb 2021.
