A First Foray into Using QGIS
In this blog post we are going to learn a little about Geographic Information Systems (GIS) and play around with QGIS, a free and open source GIS tool.
What is a GIS?
I have seen GIS mentioned a lot in discussions about using data science to solve problems related to climate change, but I never really understood what kind of data is used with a GIS or what problems it can solve. GIS is a general term that refers to computer hardware and software that is used to manipulate geographic data [1]. Apparently sometimes the term is so general, it also refers to the community of users, the common workflows for using the tool and the organizations that build and use the GIS tool [1]. But the most important aspect of a GIS system is that it allows the user to join together geographical datasets by leveraging their shared location information as the “primary key” to use a term from SQL [1]. Essentially, we have lots of datasets where the data is distributed over latitudes, longitudes and elevations, and this allows us to overlay it and look for relationships between otherwise disparate datasets [1].
The primary function of a GIS is to store geographic data. Different iterations of these systems do this in different ways - sometimes the data is stored as separate files, and sometimes as relational databases [1]. In addition to storing the data distributed over space, it is also becoming more common to see datasets stored over time as well, so you can see the temporal evolution of a geographic phenomenon [1]. A GIS can store many different types of data, but the two most commonly seen categories are discrete data (like classifications of geographic regions) and continuous data (like amount of rainfall) [1]. The GIS will also often enable analysis of the raw data to develop more complex types of data that can be overlaid on a map [1]. Typically, data is stored as either a set of raster images or as vector data [1]. More recently, 3D point clouds are also becoming more common [1].
There are many implementations of GIS tools, and currently ArcGIS is the industry standard, maintained by Esri [1]. Since I am on a grad student budget, I was interested in the available free and open source platforms available, and it appears that QGIS is a popular alternative to ArcGIS.
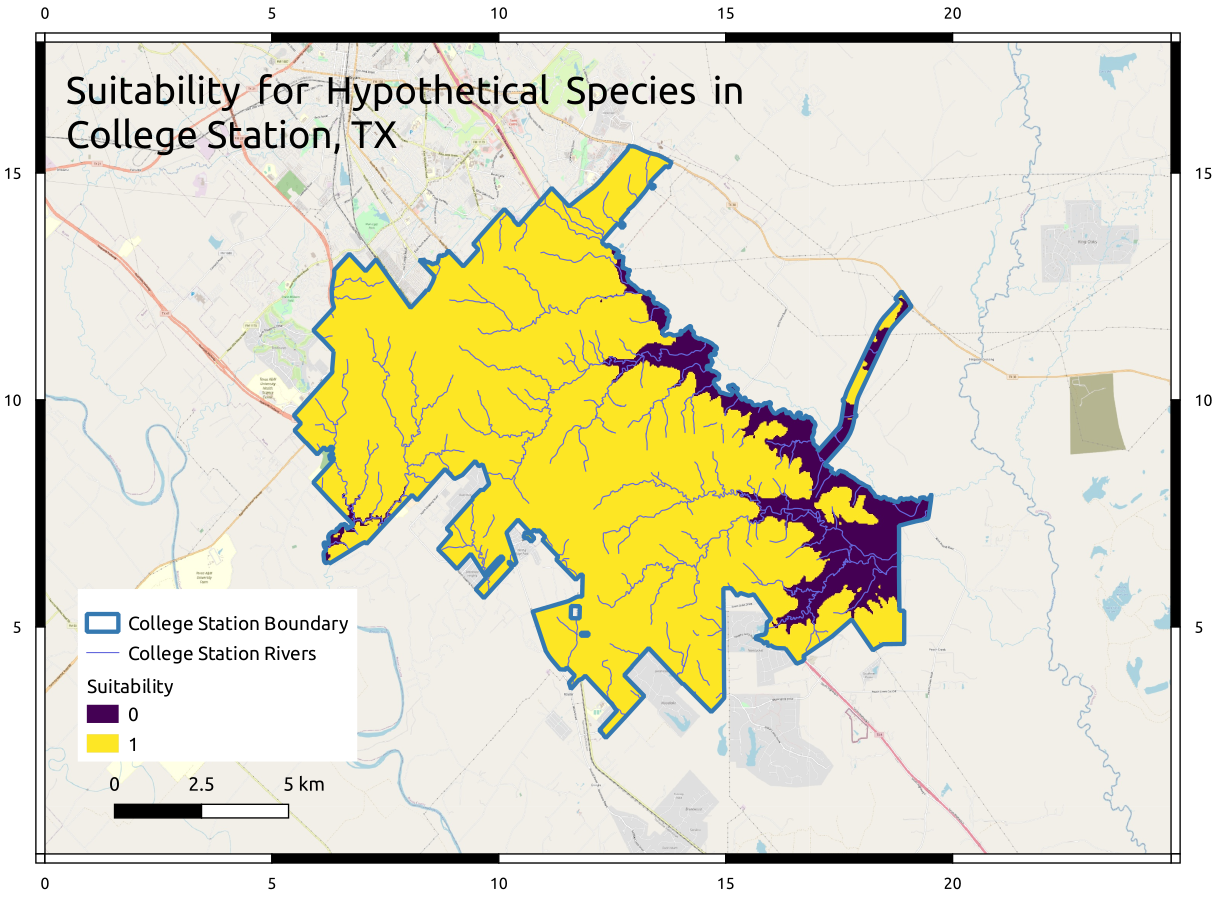
I worked through Michael Treglia’s excellent introductory tutorial that showed how to build a map of a “suitability region” for a hypothetical species [2]. My final product is shown in Figure 1. Some of the topics covered in this tutorial included [2]:
- Importing raster, vector and CSV data
- Managing layers on the map
- Using plugins to import additional map layers
- Vector geoprocessing tools for clipping and differencing layers of vector data
- Vector data management tools for joining different datasets together
- Using the raster calculator to derive new layers following some mathematical operations
- Creating maps for export as PDF and other file types

Figure 1 - My rendition of a map of a suitable region for a hypothetical species, with rivers overlaid, in College Station, TX
References
[1] “Geographic information system.” Wikipedia. Visited 4 Apr 2023. https://en.wikipedia.org/wiki/Geographic_information_system#
[2] Treglia, M. L. “An Introduction to GIS Using QGIS (v. 3.0).” 13 May 2018. https://mltconsecol.github.io/QGIS-Tutorial/QGIS-Tutorial/Treglia_QGIS_Tutorial_3_0.pdf Visited 10 Apr 2023.
