What is FRET?
I’m going to switch gears in this post and write about a wildly different topic from machine learning. Today, I am going to share what I have recently learned about a fluorescent microscopy imaging technique which is called widefield Fluorescence Resonance Energy Transfer* (W-FRET) [1,2]. I want to understand how it works because it is a useful tool for studying DNA origami, but as simple as the underlying concept is, the analysis process was a little tricky to understand. I’m sure I still don’t have a complete grasp of it but I’ll share what I know so far. I’ll start by outlining the basic principle, then I will explain how the analysis is done to obtain a precision FRET image [4].
Basic Principle of FRET
Fluorescence resonance energy transfer is the name of the phenomenon that we leverage in FRET microscopy. The phenomenon itself can be observed between two different fluorophores, which are chemical compounds that can re-emit light when they are excited by some input light [5]. Each fluorophore has a range of light wavelengths that excite the molecule, and each fluorophore has a corresponding range of wavelengths along which it will emit light after being excited. These excitation and emission spectra are shown in Figure 1.
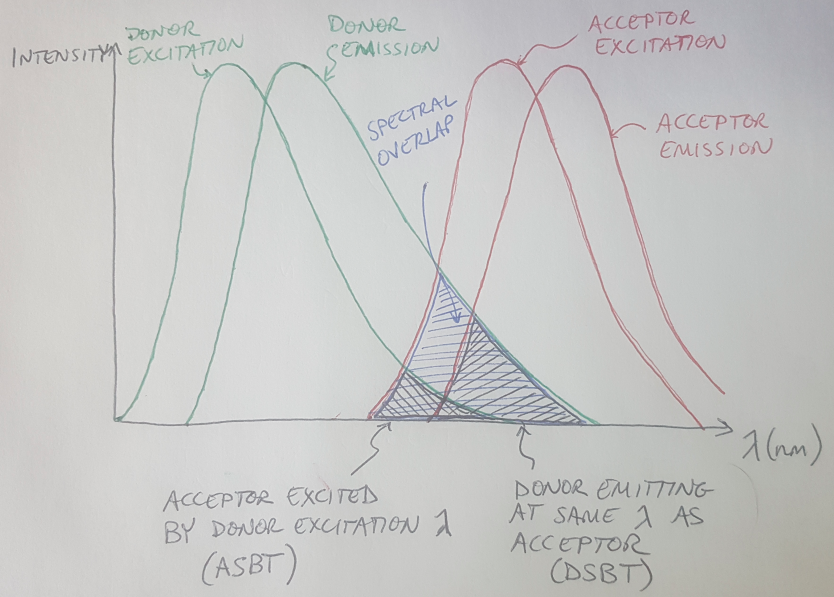
Figure 1
If you have cleverly chosen your two fluorophore types - let’s call them Fluorophore A and Fluorophore B - then you can ensure that the emission spectrum of Fluorophore A overlaps with the excitation spectrum of Fluorophore B [6]. This means that if you excite Fluorophore A, it will emit light and the emission from Fluorophore A will occur at a wavelength that is designed to excite Fluorophore B [6]. This will only happen if the two fluorophores are very close together, approximately 10 nanometers or less [2]. In this scenario, we call Fluorophore A the donor, because it donates its energy to Fluorophore B, which is the acceptor [1,2]. Look at Figure 1 again - do you see how there is a region where the donor’s emission spectrum overlaps with the acceptor’s excitation spectrum? This region is called the spectral overlap and this overlap needs to exist for FRET to occur [2].
How do scientists know when FRET is occurring? If we applied a beam of light to our sample that had a wavelength inside Fluorophore A’s excitation spectrum (the donor excitation spectrum), and we observed light being emitted by the sample in with a wavelength that was inside the acceptor’s emission spectrum, then we know that FRET is occurring. This is because the only way that light could be emitted at the acceptor’s emission wavelength is if there was some energy transfer occurring, since the light we are applying to the sample has a different wavelength.
Interestingly, this phenomenon is “non-radiative” because the fluorophores are not transferring photons, they are transferring energy [2,7]. The process can be compared to how one tuning fork, when struck, will cause a second tuning fork to start vibrating as well [2,7]. (You can see a video of the tuning fork example here!)
Why is this phenomenon so interesting to scientists with microscopes? The cool thing about FRET is that the phenomenon only occurs when the two fluorophores (we call them a FRET pair) are very close to each other [1,2]. As an example, let’s pretend I want to check if two DNA origami structures are connected to each other. The first structure is labeled with the donor fluorophore, and the second structure is labeled with the acceptor fluorophore (see Figure 2). If I have correctly connected these structures together, the fluorophores will be close enough that I could get a FRET signal from them. But if the two structures have not connected successfully, then I will not get any FRET signal. There are many other examples of using FRET microscopy in studying cells and other biological systems, as well [2].
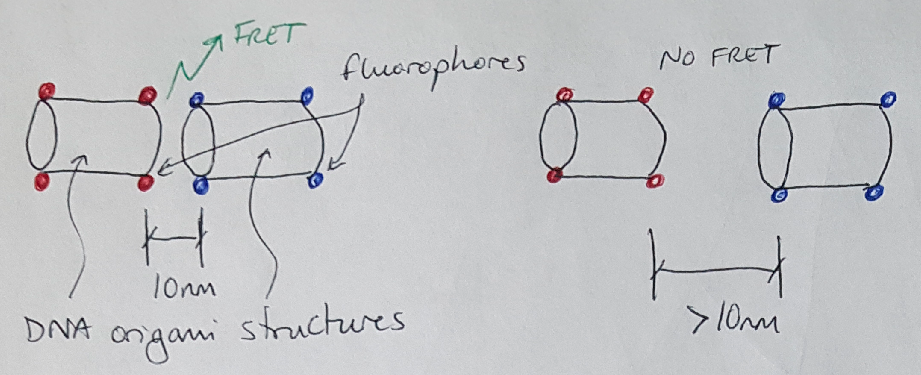
Figure 2
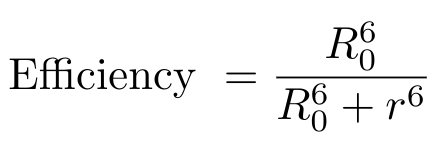
Let’s use some mathematics to describe FRET a little more formally. We can describe the efficiency of this energy transfer process using the following equation [2]:
Equation 1
R0 is the distance between the donor and acceptor fluorophores at which the FRET efficiency is exactly 50% - this is also called the Forster distance [2]. The value r is the actual distance between the fluorophores [2]. Typically, the Forster distance is 2 - 9 nanometers [2]. You can see from this equation that as the distance between the fluorophores decreases, the FRET efficiency increases.
There are actually two pieces of evidence to indicate that FRET has occurred [2]. First, if we observe a decrease in the intensity of the donor’s emission signal intensity, then we know that some of that energy has gone to excite the acceptor [2]. And secondly, if there is an increase in the acceptor emission signal intensity, then we also know that FRET is occurred because there is no other explanation for where that signal came from** [2].
What are some of the factors that we should consider before we use FRET to study our DNA origami samples? For one thing, you want to have relatively balanced concentrations of the donor and acceptor fluorophores in your sample [7]. Otherwise, if you have a much higher concentration of one fluorophore compared to the other, the stronger signal will drown out your images, while you will see almost no signal from the other fluorophore [7]. Another problem that you have to correct for (more on this in a minute) is spectral cross-talk, which can happen a couple of different ways, but always has a detrimental effect on your FRET imaging [7]. One example of spectral cross-talk is when the acceptor is excited by the same wavelength that is used to excite the donor [7]. This can be seen in Figure 1 - the region labeled “ASBT” shows the region of overlap where both the donor and acceptor fluorophores are being excited by the excitation signal, and not by the FRET phenomenon. ASBT stands for acceptor spectral bleed-through, and this is another term to describe this cross-talk effect [4]. This cross-talk contaminates your signal, because now some part of the acceptor emission signal is caused by excitation from your input signal, not from FRET [7]. You will need to use an analytical tool to eliminate that source of signal from your images. Another example of cross-talk comes from having the donor emitting light at the same wavelength as the acceptor (see the region labeled “DSBT” in Figure 1) [7]. In this situation, the acceptor emission signal that you are measuring comes, in part, from the donor fluorophore and not from FRET [7].
It is possible to try to minimize the effects of spectral cross-talk by choosing fluorophore pairs that have excitation and emission spectra that are fairly far apart [2]. For example, our lab favors Cy3 and Cy5 (these are organic cyanide dyes) and Cy3 emits at 570nm and Cy5 emits at 670nm [2]. This is equivalent to a Forster distance of over 5nm which is pretty distant for FRET, but both Cy3 and Cy5 emit signals for a long time (they have high extinction coefficients) so we can get away with using them as a FRET pair [2]. The reason I point this out is that their excitation and emission spectra are well separated, which minimizes the overlap between their curves and, by extension, the amount of spectral cross-talk. However, no matter what fluorophores you choose there will always be some cross-talk, so how can we eliminate it?
FRET Analysis to Eliminate Spectral Cross-Talk
In this section I will describe an analytical process we can use to reduce spectral cross-talk in our images. The ultimate goal of this analysis is to remove cross-talk from the donor and acceptor - also called spectral bleed-through - from our image to obtain a precision FRET (pFRET) image [4]. We can write this as follows [4]:

Equation 2
How do we calculate ASBT and DSBT? This is kind of a cool process, and requires that we take 7 images of our sample in 3 different configurations [4]. I have laid out the 7 images that we need in Figure 3. Notice that we need to take these images across 3 configurations: (1) our sample with both the donor and acceptor fluorophores, (2) our sample with only the donor fluorophore and (3) our sample with only the acceptor fluorophore [4].
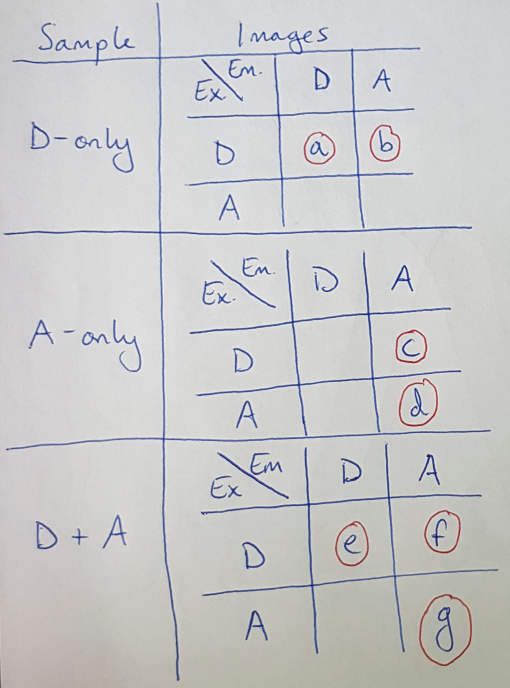
Figure 3
Once we have these images, we can use them to calculate the ASBT and DSBT by adding up intensities across all the pixels in the images. Note that we will discretize the measure of intensity into “buckets” to make the computations easier to understand here. As an example, let’s work through the calculation for ASBT [4]:

Equation 3
Notice that the letters g, c and d correspond to images listed in the table in Figure 3. We are going to add up the intensity across each pixel, indexed by i, and add up the ASBT for each intensity bucket, indexed by j [4]. But why does this equation work? Let’s rewrite Equation 3 as follows:

Equation 4
Now maybe it is more apparent that the first thing we do is calculate the amount of bleedthrough from the acceptor - in other words, we calculate how much signal intensity comes from the acceptor emission when the acceptor is excited with the donor excitation wavelength. This signal is not generated by FRET so we want to remove it. We can visualize this signal as shown in Figure 4. We then need to find the intensity of the acceptor emission signal when the acceptor is stimulated with light at the acceptor excitation wavelength - this region is also shown in Figure 4. Do you see how we can calculate the ratio, or percentage, of acceptor bleedthrough as a function of the total acceptor emission signal? That is, we want to know what percentage of the blue region (the total acceptor emission signal) is taken up by the red region (the acceptor bleedthrough).
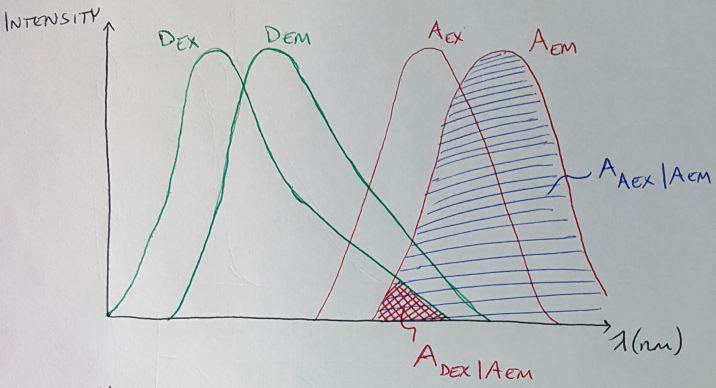
Figure 4
We then multiply this percentage by the total acceptor emission signal that we measured from the donor and acceptor sample (image g) to figure out what amount of the signal in the final FRET image came from acceptor spectral bleedthrough [4]. This gives us the value of ASBT for each pixel and each intensity bucket, and we can sum up this value over the number of pixels and the number of intensity buckets.
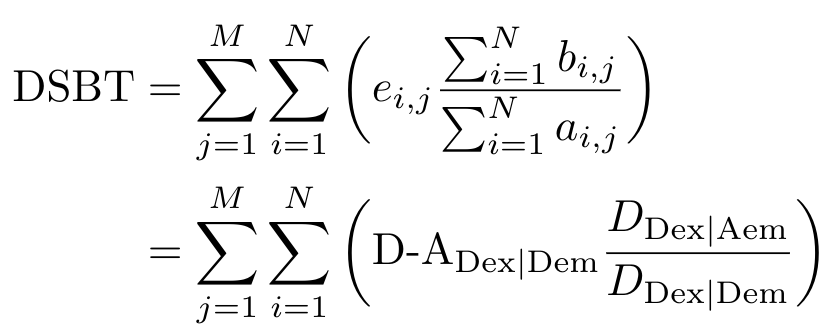
The process for calculating DSBT is the same - let me give you the equation and the corresponding figure for the calculation to see if you can figure it out.
Equation 5
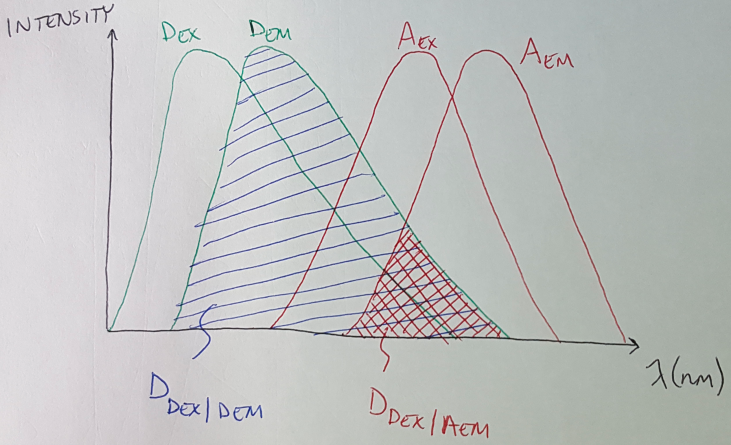
Figure 5
Once we complete our calculations for ASBT and DSBT, we can plug those values into Equation 2 to get our final pFRET image. (Notice that image f from Figure 3 is the FRET image in Equation 2 that we are adjusting to get our final pFRET image.)
I hope this explanation has helped clarify how FRET works and how we can analyze our images. Thanks for reading!
Footnotes:
*The “F” in FRET can also stand for Forster, the German scientist who contributed to the scientific community’s understanding of FRET by studying the Forster radius, which affects the FRET phenomenon [3]. I feel obligated to also mention that he was a member of the Nazi Party and the SA [3].
**Well, no other likely explanation, anyway. I realize that aliens may have generated the signal or something, that’s always a possibility.
References:
[1] Periasamy, A. “Widefield FRET Microscopy.” UVA Arts & Sciences: W.M. Keck Center for Cellular Imaging. 2015. http://www.kcci.virginia.edu/fret/widefield Visited 21 May 2020.
[2] Held, P. “An Introduction to Fluorescence Resonance Energy Transfer (FRET) Technology and its Application in Bioscience.” BioTek. 20 June 2005. https://www.biotek.com/resources/white-papers/an-introduction-to-fluorescence-resonance-energy-transfer-fret-technology-and-its-application-in-bioscience/ Visited 21 May 2020.
[3] “Theodor Forster.” Wikipedia. https://en.wikipedia.org/wiki/Theodor_F%C3%B6rster Visited 21 May 2020.
[4] Periasamy, A. “Data Processing.” UVA Arts & Sciences: W.M. Keck Center for Cellular Imaging. 2015. http://www.kcci.virginia.edu/fret/dataprocess Visited 21 May 2020.
[5] “Fluorophore.” Wikipedia. https://en.wikipedia.org/wiki/Fluorophore Visited 21 May 2020.
[6] Bhandawat, A. “What is FRET (Fluorescence Resonance Energy Transfer).” XploreBio on YouTube. https://www.youtube.com/watch?v=qwMdtqgdap0 Visited 21 May 2020.
[7] Shen, M. “Fluorescence Resonance Energy Transfer (FRET) Principles.” BenchSci. 26 Feb 2018. https://blog.benchsci.com/fluorescence-resonance-energy-transfer-fret-principle Visited 21 May 2020.
