Non-Minimum Phase Systems
Last week during a controls qual study session, I realized that I did not fully understand what non-minimum phase systems were. So I am going to briefly discuss what they are physically, and how that manifests itself in Bode plots, time domain responses and Nyquist plots. Let’s get started!
First let’s get some physical intuition for these systems. Steve Brunton suggests that we think about an airplane that wants to gain altitude [1]. Airplanes gain altitude by turning their elevators (a control surface on the tail of the aircraft) up, which causes the tail of the plane to go down [1]. As the elevator is moving up and the tail is moving down, the entire airplane loses a little altitude before it stabilizes in its new attitude and begins to climb [1]. This is how a non-minimum phase system behaves: there is some delay between when the control input is given to the system, and when the system responds to that control [1]. If you look at Figure 1 below, the time domain response of a non-minimum system is shown, and we can see that there is indeed a dip downwards before the system starts to respond to the control input and approach 1.
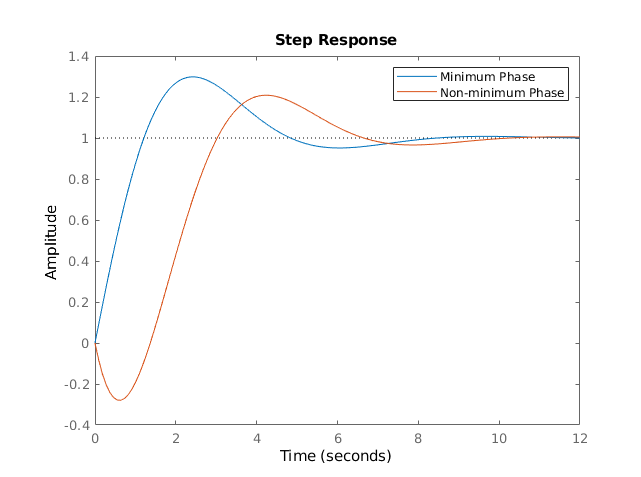
Figure 1
How does the time delay in a non-minimum phase system translate to the frequency domain? If you recall our discussion of lead controllers from a while back, then you remember that the phase shift (specifically shift backwards, or lag) is equivalent to a time delay. Systems with the smallest ranges of phase shift are called minimum phase; systems that have some non-minimum amount of phase shift are called non-minimum phase systems [2]. One common example of non-minimum phase systems are systems with right-half plane (RHP) zeros, although this is not the only situation where non-minimum phase systems occur [2].
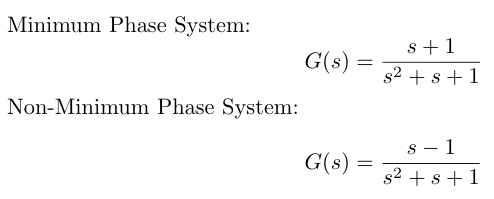
The tricky thing about non-minimum phase systems is that they have the same Bode magnitude plots as minimum phase systems [2]. The only difference is that the Bode phase plot for a non-minimum system has more phase than for a minimum system [2]. Put another way, while every magnitude plot will display a high frequency asymptote with slope -20(n-m) dB/dec, only minimum phase systems will display a phase plot with a high frequency phase asymptote at -90(n-m) degrees [2]. I have put the Bode plots of two such systems in Figure 2 below to illustrate this difference.
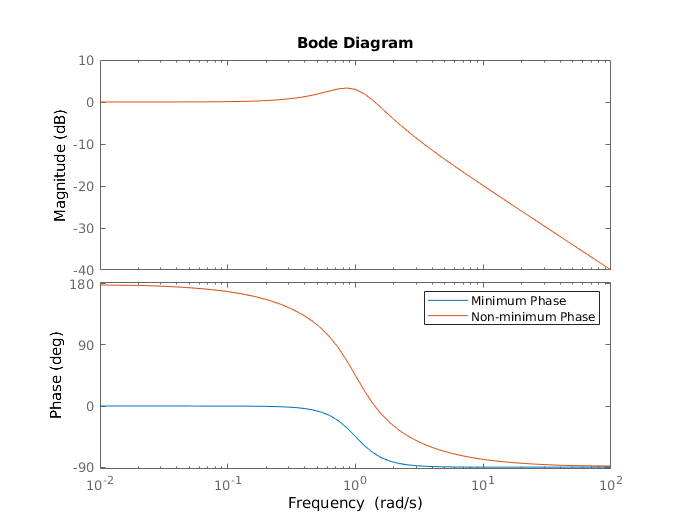
Figure 2
Since a minimum phase system obeys all the Bode plot rules, you should be able to analytically determine the transfer function for such a system from the Bode magnitude plot alone [2]. However, you should be able to identify a non-minimum phase system from the fact that its phase plot is inconsistent with the transfer function you would expect to see based on the Bode magnitude plot alone [2].
I mentioned earlier that one common example of non-minimum phase systems are systems with RHP zeros. Another category of non-minimum phase systems are those with delays built in, where x(t) is the input and y(t - T) is the output, and T is some delay time [2]. If we have such a system, we can approximate the delay using a Pade approximation and calculate the resulting phase of the system [2]. We can see that the phase is large and negative, which makes these systems non-minimum phase systems [2].
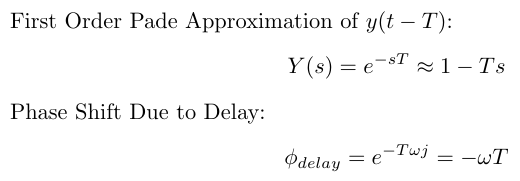
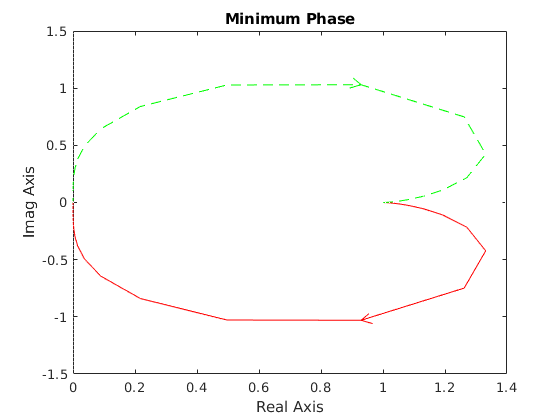
Figure 3
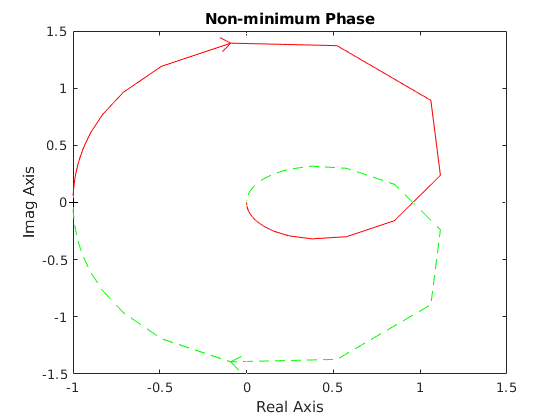
Figure 4
References:
[1] Brunton, S. “Control systems with non-minimum phase dynamics.” University of Washington. https://www.youtube.com/watch?v=7GjnvuKeWI8 Visited 09/27/2019.
[2] Richter, H. “Lecture 13: More About Bode Plots; Non-Minimum Phase Systems; Systems with Delay; Polar Plots.” Cleveland State University. https://pdfs.semanticscholar.org/b7c7/d589d0edca3026637b86a949fddad30936f1.pdf Visited 09/27/2019.
