Shining Some Light on Spectrophotometry
The Microsystems and Mechanobiology Lab’s spectrophotometer, a Nanodrop 2000 model, is one of the workhorses of our lab. We use this instrument to measure the concentration of DNA in a sample, which is a critical piece of information when building DNA origami structures for use in studying cells, nanoscale self-assembly and shear forces on the microscale. I wanted to do a deep dive into how spectrophotometry works and what the data is telling us, so I’m going to take you on the journey with me. We will start by introducing the spectrophotometer’s operating principle, then discuss how the Nanodrop 2000 works, and conclude with some tips and tricks for taking good measurements. Let’s get started!
The Operating Principle of Spectrophotometry
In a sentence, spectrophotometry relies on the fact that when we shine light through a sample, the amount of light that is absorbed is directly related to the concentration of some target material (DNA, in our case) in that sample [1]. Our spectrophotometer, therefore, is performing two tasks: it is shining light on the sample with a xenon lamp (i.e. it is acting as a spectrometer) and it is measuring the amount of light absorbed across the ultraviolet spectrum (i.e. it is acting as a photometer) [1]. Note that ultraviolet light has wavelengths between 10 and 400nm, which is shorter than visible light [2].
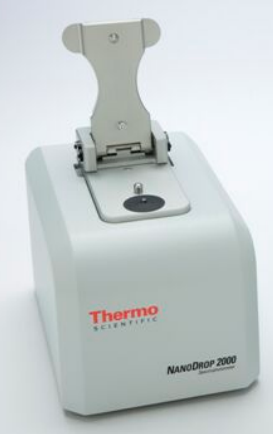
Figure 1 - Source: [6]
For our lab, the most important target material to study is DNA. What part of DNA absorbs the incident UV light? Asami tells us that “the aromatic base moieties in nucleic acids absorb UV light at 260nm” [1]. I didn’t really understand that sentence at first, so let me break it down for us. First let’s talk about the structure of DNA (I covered this topic in some earlier posts as well): DNA has a backbone made of sugars and phosphate groups, and it binds together into a helical structure via hydrogen bonding between nitrogenous bases. These nitrogenous bases (adenine, cytosine, guanine and thymine) are composed of 1-2 aromatic bases. An aromatic base is a cyclic, planar structure that has pi-bonds that are in resonance, and it must carry a nitrogen atom [3-4]. All 4 nitrogenous bases meet this criteria, and could be defined as “moieties”, because a moiety is just a part of a larger molecule [5].
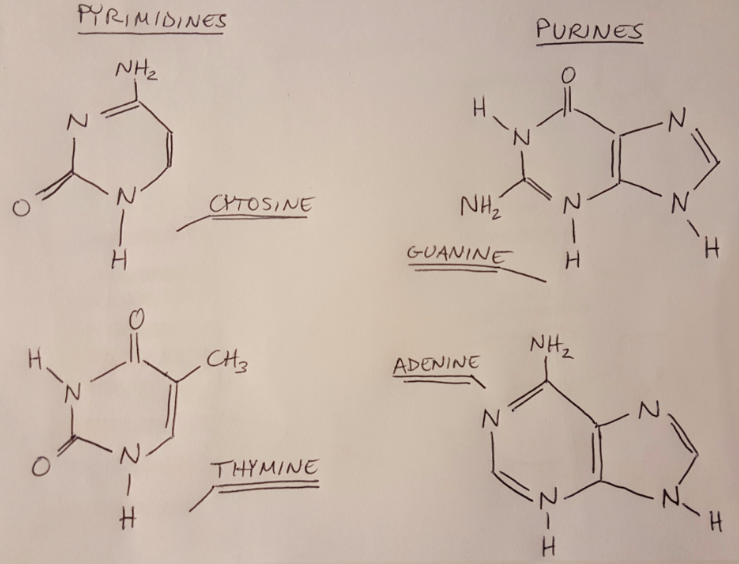
Figure 2
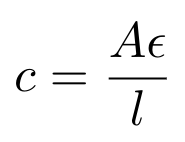
So now we see that the nitrogenous bases in the DNA are absorbing UV light, and their absorption is centered around a wavelength of 260nm. Note that DNA absorbs light at a range of wavelengths, but we think about the absorption of DNA at 260nm specifically because this is typically where most of the absorption occurs (imagine that the amount of light that the DNA is absorbing could be modeled as a Gaussian curve). The spectrophotometer will send light through a sample of our DNA origami and measure how much light at 260nm it is absorbing. We can then use the Beer-Lambert law to convert the amount of light absorbed to a concentration of DNA [6]:
Equation 1
Where A is the absorption of light at 260nm measured in absorbance units, AU; epsilon is the wavelength-dependent molar absorptivity coefficient in ng-cm/uL; L is the pathlength, i.e. the distance that the light travels through the sample in cm and C is the concentration of DNA in the sample in ng/uL [6]. The Nanodrop software typically sets epsilon = 50 ng-cm/uL for double-stranded DNA (dsDNA) and 33 ng-cm/uL for single-stranded DNA (ssDNA) [6]. There is a difference in absorptivity coefficient here because dsDNA tends to see more base stacking, and this decreases the absorption of dsDNA in comparison to ssDNA [7].
Once we know the concentration of DNA in our sample, we can convert the concentration from units of ng/uL to mol/L using the calculated molecular weight for our specific structure. Note that because this calculation assumes that the sample is comprised of a monodisperse population of only our desired structure, so we should always purify our samples before measuring their concentration with the Nanodrop! Otherwise we will be measuring how our specific structure and all the extra staple strands floating in solution absorb UV light [6].
How the Nanodrop 2000 Works
Now that we have a basic understanding of the principle of spectrophotometry, let’s talk a little more about how the Nanodrop 2000 works. The Nanodrop 2000 has a pedestal with a fiber optic cable embedded inside it. We place a 0.5 - 2.0 uL drop of our sample on this pedestal, and then lower an arm that also has a fiber optic cable embedded in it [6]. Once the arm is down, a diaphragm lowers the pedestal slightly to stretch the droplet to create a desired pathlength. The Nanodrop can set the pathlength between [0.2, 1.0]mm, which is useful because samples with different concentrations will absorb different amounts of the incident light [6]. For example, a highly concentrated sample could absorb so much light that it would be difficult to detect the results for a pathlength of 1mm - so instead the Nanodrop reduces the pathlength to 0.2mm, bringing the absorption measurement to within a detectable range by the CCD camera*.
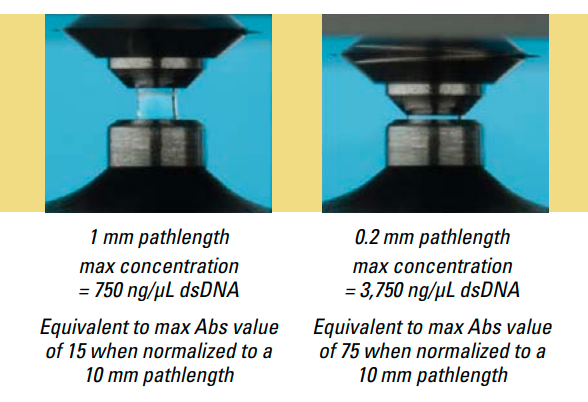
Figure 3 - Source: [8]
Notice above that the droplet size can vary between 0.5 and 2.0uL. The manufacturer notes that the surface tension of a droplet is dependent on the amount of hydrogen bonding occurring within the lattice of water molecules in the droplet [6]. If the droplet contains other material, such as DNA, this can negatively impact the hydrogen bonding and thereby reduce the surface tension of the droplet. If you think that your droplet is not able to hold a liquid column as shown in Figure 3 (usually evidenced in the measured spectrum by a jagged curve), then you can increase the volume of the droplet to compensate for the reduced surface tension [6].
The manufacturer also recommends that you always begin the measurement procedure by measuring a blank sample - that is, by measuring the absorbance of your solvent, without any DNA present. The intensity of the blank is then used to correct the measured intensity of the actual sample via the following formula [6]:

Equation 2
The Nanodrop analytical software also corrects the measured intensity by doing a baseline correction at 340nm. This corrects for light scattering artifacts and instrument noise [6]. (This is also called bichromatic normalization [6].)
Tips and Tricks for Taking Good Measurements
I will end with a list of some random advice, but before I get there, I want to talk about what values you should be reviewing every time you take a measurement. A good example spectrum is shown in Figure 4 below. In this plot, you can see the characteristic components of a DNA UV absorption curve: the trough at approximately 230nm, the peak at 260nm and the downslope after the peak passing through 280nm, followed by a flat line above 300nm [8]. If your curve does not look like Figure 4, then you can troubleshoot your measurement per [8]. One reason that the location of the trough or peak might change is if the solution pH is highly acidic or basic. Acidic solutions tend to decrease the 260/280 ratio (see below) by 0.2-0.3, and highly basic solutions tend to increase the 260/280 ratio by the same amount [8].
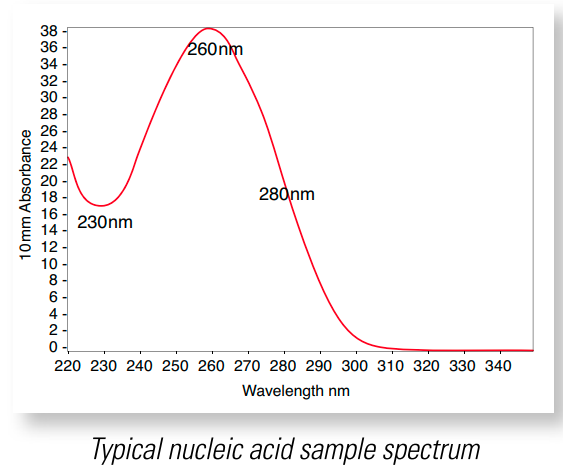
Figure 4 - Source: [8]
You should also check the 260/280 ratio and the 260/230 ratio returned by the measurement software. The 260/280 ratio is the ratio of absorbance of the sample at 260nm and 280nm. It is a metric for purity. This is because some contaminants, such as proteins and phenol groups, tend to absorb UV light at 280nm, so if they are present, they will force the 260/280 ratio to be lower than it should be for pure DNA [1,6,8]. An ideal 260/280 ratio is approximately 1.8 [6].
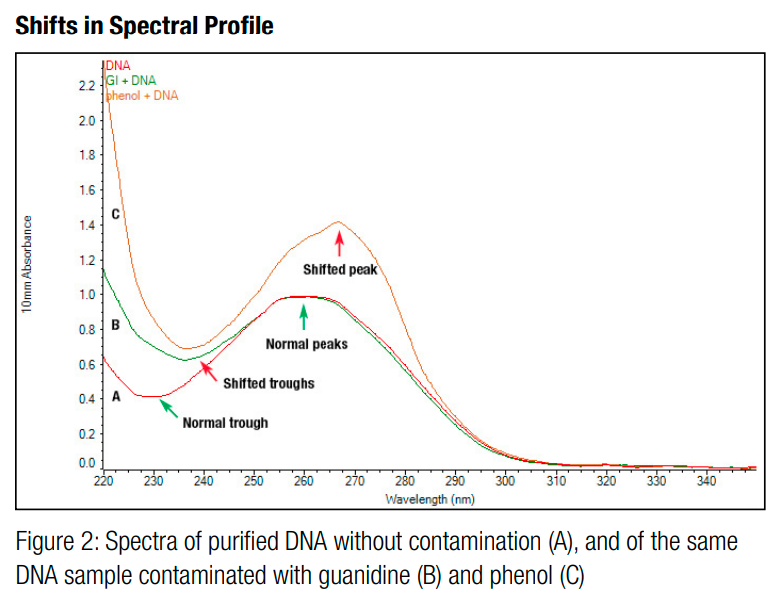
Figure 5 - Source: [9]
Similarly, the 260/230 ratio is the ratio of absorbance of the sample at 260nm and 230nm. Other contaminants, including peptide bonds and chaotropic salts, tend to absorb UV light between 200nm and 230nm, so if the 260/230 ratio is low, it is an indication that there are contaminants present that are absorbing some of the light at this wavelength [1,6,8]. An ideal 260/230 ratio is somewhere between 1.8 and 2.2 [6].
Note that you should also be relying primarily on the A260 data returned by the Nanodrop, and you should compare your calculated concentration to the provided ng/uL value as a reference only [6].
Finally, let me close by listing some other tips on using the Nanodrop [6]:
- Use a precise pipettor (i.e. 0-2uL) to place samples on the Nanodrop. Do not use the larger sizes such as the 0-10uL pipettor.
- Measure a new blank sample every 30 minutes.
- After using the “Blank” button on the Nanodrop software, use the “Measure” feature on a second blank sample to make sure that measured spectrum shows a variation of less than 0.04AU.
- You can perform an intensity check and a calibration check in the diagnostics task bar of the Nanodrop software. Calibration requires a special test solution provided by Thermo Scientific and is recommended every 6 months.
- If you are measuring the concentration of short oligonucleotides, the absorptivity coefficient may vary from the standard values for dsDNA and ssDNA so you should compute the coefficient manually.
Footnotes:
- This is a little speculative on my part, and if you know a better explanation for this, please let me know!
References:
[1] Asami, P. “Spectrophotometry (Quantification of Nucleic Acids).” BecA-ILRI Hub, Introduction to Bioinformatics and Molecular Biology (IMBB). May 2015. http://hpc.ilri.cgiar.org/beca/training/IMBB_2015/lectures/Spectrophotometry_IMBB_2015.pdf Visited 05 Apr 2021.
[2] “Ultraviolet.” Wikipedia. https://en.wikipedia.org/wiki/Ultraviolet Visited 05 Apr 2021.
[3] “Category: Aromatic bases.” Wikipedia. https://en.wikipedia.org/wiki/Category:Aromatic_bases Visited 05 Apr 2021.
[4] “Aromaticity.” Wikipedia. https://en.wikipedia.org/wiki/Aromaticity Visited 05 Apr 2021.
[5] “Moiety (chemistry).” Wikipedia. https://en.wikipedia.org/wiki/Moiety_(chemistry) Visited 05 Apr 2021.
[6] “NanoDrop 2000/2000c Spectrophotometer v1.0 User Manual.” Thermo Fisher Scientific. https://www.thermofisher.com/document-connect/document-connect.html?url=https%3A%2F%2Fassets.thermofisher.com%2FTFS-Assets%2FCAD%2Fmanuals%2FNanoDrop-2000-User-Manual-EN.pdf&title=TmFub0Ryb3AgMjAwMC8yMDAwYyBTcGVjdHJvcGhvdG9tZXRlcnMgLSBVc2VyIE1hbnVhbA== Visited 05 Apr 2021.
[7] Kothekar, V. “Techniques Used in Molecular Biophysics II.” PG Pathshala-Biophysics, AIIMS New Delhi. http://epgp.inflibnet.ac.in/epgpdata/uploads/epgp_content/S001174BS/P001858/M030435/ET/1526639139P10_M10_ET.pdf Visited 05 Apr 2021.
[8] “Nucleic Acid.” Thermo Scientific NanoDrop Spectrophotometers. https://assets.thermofisher.com/TFS-Assets/CAD/manuals/ts-nanodrop-nucleicacid-olv-r2.pdf Visited 05 Apr 2021.
[9] Matlock, B. “Assessment of Nucleic Acid Purity.” Thermo Fisher Scientific, Technical Note 52646. https://assets.thermofisher.com/TFS-Assets/CAD/Product-Bulletins/TN52646-E-0215M-NucleicAcid.pdf Visited 05 Apr 2021.
