Applying GANs to Graphs
There is a lot of amazing work in the area of applying neural networks and AI approaches to graphs. Graphs, as I’ve explained before, are a powerful way of conveying the relationships between objects. They also represent a way that humans interpret and think about the world around them, which gives researchers hope that applying AI tools to graphs will bring us closer to building Artificial General Intelligence (AGI) solutions that mimic the way the human brain works. In this post, I want to explore one specific application of an AI tool to graphs.
Actually, we are going to see that I really want to look at how we apply two different AI tools to graphs (both generative adversarial networks and convolutional networks), but we’ll get there in a minute. We will start with looking at how one team of researchers applied a generative adversarial network (GAN) to graph data: this approach is called MolGAN [1]. MolGAN is an AI tool that is able to generate novel designs for molecules, and the molecules are represented as graphs [1]. The nodes of the graph represent specific atoms, while the edges describe single, double or triple bonds that exist between the atoms [1]. Not only does MolGAN generate novel molecules, but it also can try to find molecules that meet desired criteria, like solubility in water or “druglikeness” [1]. The authors describe this as a reinforcement learning approach to graph generation [1].
In this series of posts, I want to understand how MolGAN works. First, we will need to discuss how MolGAN represents graphs, and we will outline the GAN structure that MolGAN uses. Then we will explore how the weights of the GAN’s neural networks are trained, and we will go into more detail on the relational graph convolutional networks that are used in MolGAN’s discriminator and reward functions. Finally, we will end by touching on some of the challenges involved in building and training GANs for graphs.
One Way to Represent Graphs
I’m going to present one way to represent graphs mathematically, although I should note that I’m not sure that this is the only way, or the best way for all applications. But after reading a little more widely about graph theory, I do think that this is a commonly used method. Let’s dive in.
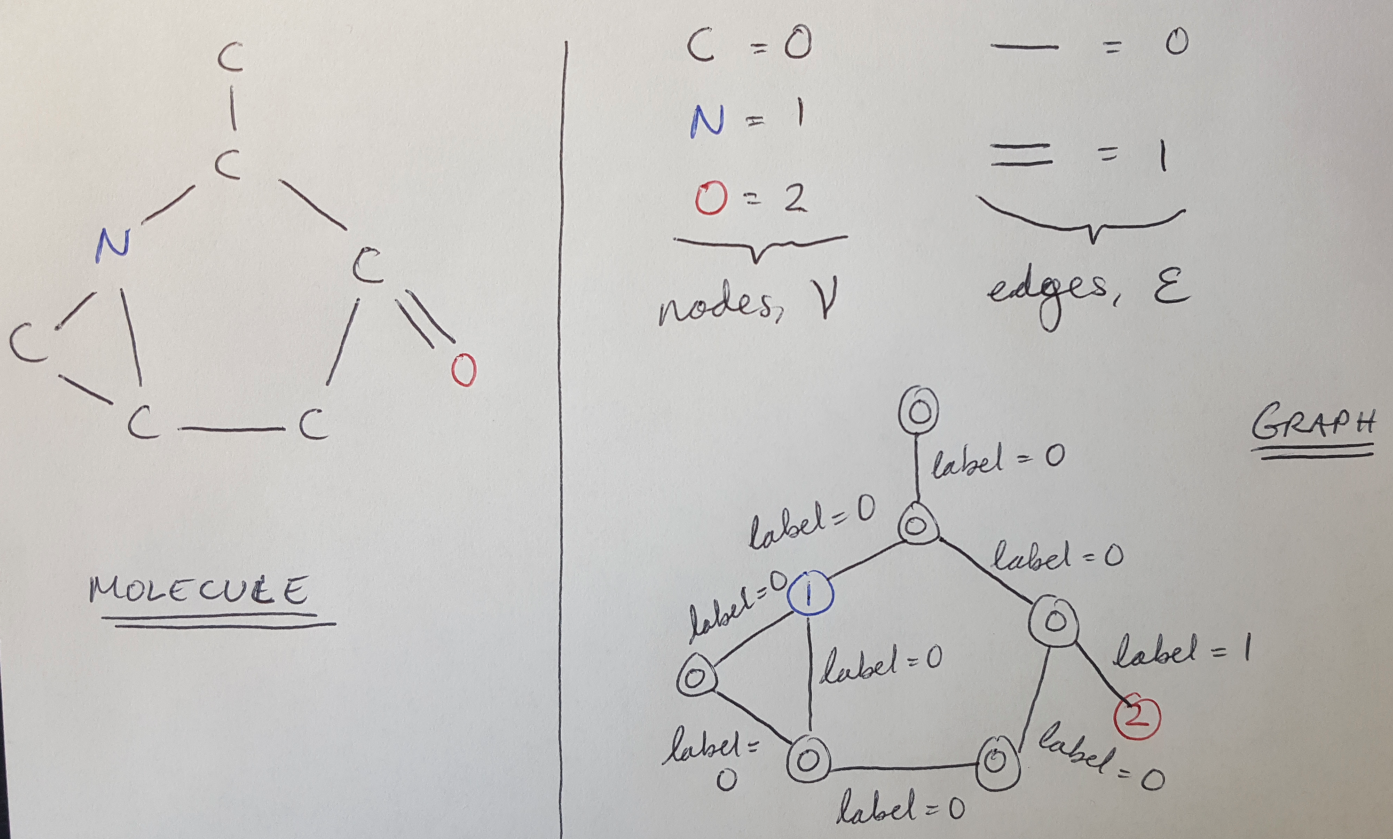
As an example, let’s say that we want to represent this molecule (shown below) as a graph. Each atom in the molecule corresponds to a graph node, and each bond can be represented as an edge. I have put the graph representation next to the molecule diagram in Figure 1.

Figure 1
As shown in Figure 1, we can represent the edges as a set E, and the nodes as a set V [1]. Together the edges and nodes represent a graph, G [1]:

Equation 1
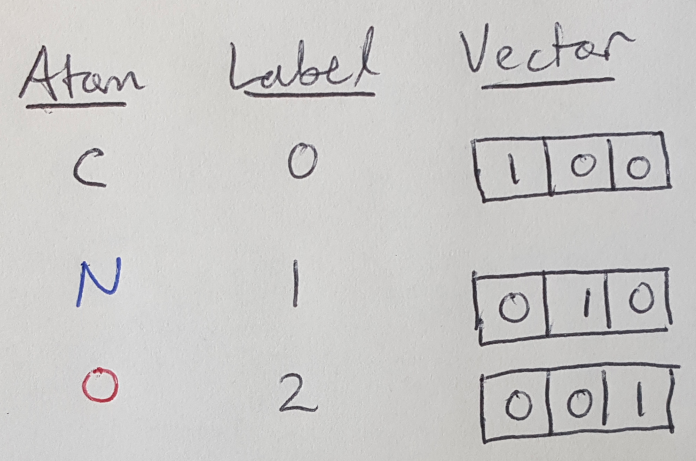
But mathematically, how can I describe the nodes and edges? The nodes are relatively easy to describe - I can use a one-hot vector, x, of length, T, to describe each node [1]. For example, we have 3 types of atoms (nodes), so to describe each node I can use a vector of 3 entries, where the 1 entry corresponds to the type of atom that corresponds to a particular node [1]. We show this in Figure 2. Now we can assemble all the information about our nodes into a node feature matrix, X, with dimensions N x T (where N is the number of nodes) [1].

Figure 2
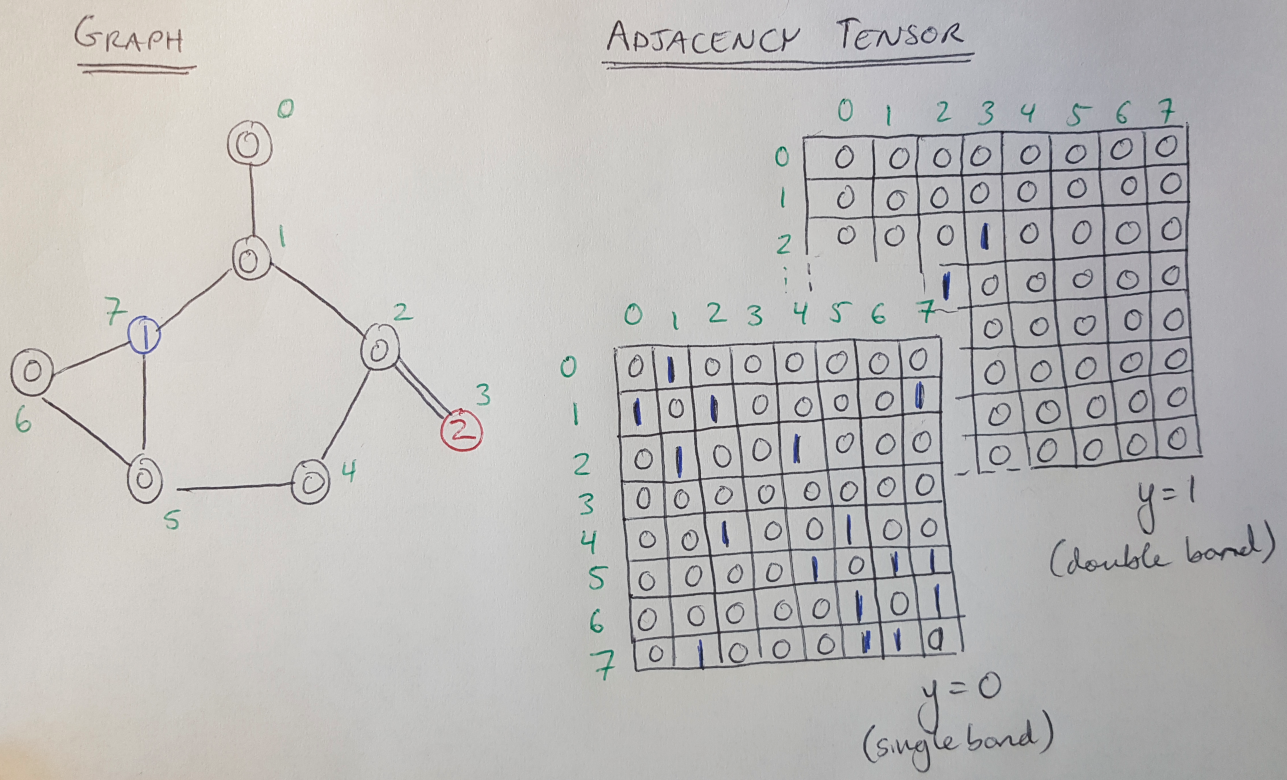
Similarly, every edge connects two nodes, (v-i, v-j), and every edge has a type (single or double bond) [1]. We can say that we have Y types of edges (Y = 2 in this case) [1]. We can define an adjacency tensor, A, with dimensions N x N x Y, that describes the types of edges that connect every node [1]. We illustrate what this tensor looks like in Figure 3.

Figure 3
Notice that the adjacency tensor is symmetric because this is an undirected graph [1]. That is, we assume that the connection flows both ways.
Now that we have a sense of how graphs can be encoded using the node feature matrix, X, and the adjacency tensor, A, we can start to learn how MolGAN processes graphs.
The Structure of MolGAN

Figure 4 - Source [1]
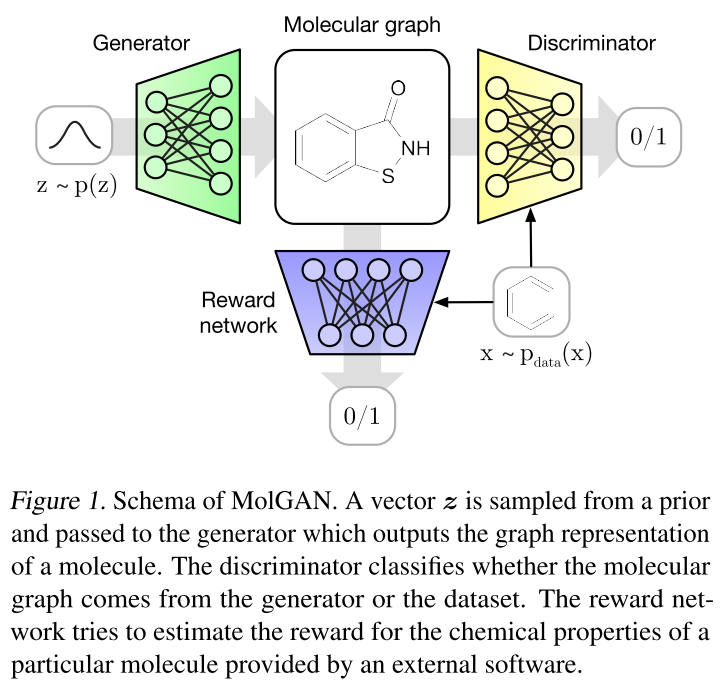
As with classical GANs, MolGAN’s structure revolves around a generator and discriminator, as shown in Figure 4. The generator and discriminator are playing a minimax game*, where the generator is learning to create graphs that look real, while the discriminator is learning to tell the difference between real and fake graphs [1]. We can write this as shown below, where the generator is trying to minimize the likelihood that the discriminator will correctly identify a fake graph, while the discriminator is trying to maximize the likelihood that it can distinguish between fake and real graphs [1]:

Equation 2
The generator generates a graph by sampling points from a normal distribution, and converting them the node feature matrix, X, and the adjacency tensor, A, as described above [1]. The discriminator then looks at the graph and uses a relational graph convolutional network (R-GCN) to process it and return a scalar (between negative and positive infinity) that describes whether the discriminator thinks the graph is real or fake [1].
MolGAN modifies the classic GAN structure by adding a reward function to the overall structure [1]. The reward function can be used to tell us if the molecules that are being generated meet some criteria, such as solubility in water or “druglikeness” [1]. The reward function also uses an R-GCN to process the graphs and return a score (in this case between 0 and 1) [1]. The reward function is trained using an external software package that is also capable of scoring the molecules. The reason that we want to train a neural network to serve as our reward function is that we want to use the gradients from the reward function to guide the optimization of the generator [1]. I will go into this in more detail in a subsequent post.
Hopefully we now have a basic understanding of how we can mathematically represent graphs and how the MolGAN architecture is arranged. In the next post, we will discuss the objective function used to train MolGAN and how we optimize it. Later on, we will discuss relational graph convolutional networks, and close with a discussion of some of the difficulties in building and training GANs for graphs.
Footnotes:
- A minimax game is described as a game where two players are playing a zero-sum game [2]. The objective of a minimax game is to minimize the loss, assuming that the player is already in a worst case (i.e. maximum loss) situation [2]. The minimax value for a given player is the smallest value that the other player can force them to receive, assuming that the other player does not know their actions [2]. So if we look at the GAN from the point of view of the generator, the “lowest score” that the generator can receive on a graph that it generates is the minimax value, assuming that the discriminator does not know a priori that it is looking at a fake graph.
References:
[1] N. De Cao and T. Kipf, “MolGAN: An implicit generative model for small molecular graphs,” arXiv Prepr. arXiv 1805.11973, May 2018.
[2] “Minimax.” Wikipedia. Visited on 29 Jul 2020. https://en.wikipedia.org/wiki/Minimax
